

Data Drop
The Financing Fault Line in Kids’ Mental Health
by Xiayun Tan, PhD and Robin Ghertner, MPP
BLUF:
For-profit facilities now make-up a quarter of all children’s mental health facilities, growing by 130 percent from 2021 to 2024.
This far out-paced non-profit and public facilities in 2024, which grew around 30 percent.
For-profit facilities are far less likely to accept public funding and far more likely to take cash, creating divergent access pathways depending on a family’s type of coverage and ability to pay.
Three-quarters of for-profits accepted Medicaid, compared to 95 percent of non-profit and public facilities.
95 percent of for-profits accepted cash payments, compared to less than 90 percent of non-profit and public facilities.
Access to care seems to be increasingly driven by families’ ability to pay, not need for services.
Financing Treatment is at the Center of the Growing Child Mental Health Crisis
Previous Wonk analysis pointed to the worsening of children’s mental health; particularly among kids in foster care.
The mental health system’s capacity to treat children—especially those in foster care—depends as much on how services are financed as on how many facilities exist.
As federal funding shifts following the One Big Beautiful Bill Act (PL 119-21) and state budgets tighten in response, understanding how children’s mental health facilities are actually financed is essential—and mostly missing from the debate.
We’re filling this gap using the latest data from the National Substance Use and Mental Health Services Survey (N-SUMHSS).
We looked at what funding sources children’s mental health facilities accept, and differences by who operates a facility - whether it’s a for-profit, non-profit, or government-run facility. The data don’t permit looking at funding amounts.
All differences we talk about are statistically significant at p<0.05. Details on our approach can be found in the Methodological appendix.
Who Pays for Mental Health?
Over 8,000 facilities nationwide provide mental health treatment for children. Understanding how those facilities are financed is central to any discussion of access or reform.
A recent premium Wonk analysis showed that Medicaid is the dominant payer for children’s mental health treatment.
But it operates within a complex patchwork of public and private sources that vary by state and ownership structure (Weil, 2025).
Facilities can take funding from several sources:
Medicaid
Private insurance
Cash payments
Other federal sources, such as the Community Mental Health Services Block Grant (totaling over $1 billion for FY2023), the Community Services Block Grant, and the Social Services Block Grant.
Other state and local sources, including funds from state mental health agencies or child and family services agencies. (Note: we can’t separate state from local in the data).
Other sources, such as private foundations
Facilities routinely make decisions about which payers they will take.
Lower reimbursement, administrative burden, or reporting requirements can make some funding streams functionally inaccessible — especially for smaller or privately financed providers.
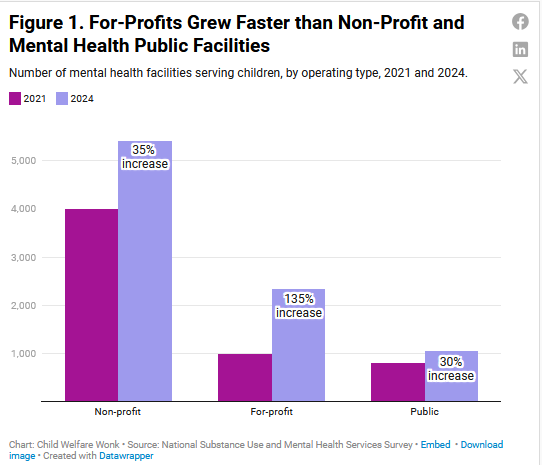
More Facilities, More For-Profits
Between 2021 and 2024, there was a 50 percent increase in mental health facilities serving children–from about 5,500 to about 8,800.
But the expansion wasn’t evenly distributed among provider types.
It was in large part driven by a rapid expansion in for-profit providers.
Three ownership types make up the landscape:
For-profit facilities, which grew by 135 percent, to 2,329 in 2024– making up 26 percent of all facilities.
Non-profits, which grew by 35 percent, now make up 61 percent of all facilities.
Public facilities – run by federal, state, local and tribal governments– which grew by 30 percent, and now make up 12 percent.
The growth in for-profits is not uniform across states. Their footprint ranges from less than 3 percent of all facilities (Kansas) to 70 percent (Indiana).
States with less than 10 percent of facilities being for-profit include: Kansas, South Dakota, Missouri, Vermont, South Carolina, Alaska, New York, New Hampshire, and Oregon.
States with over 50 percent include: Indiana, North Carolina, Utah, and Maryland.
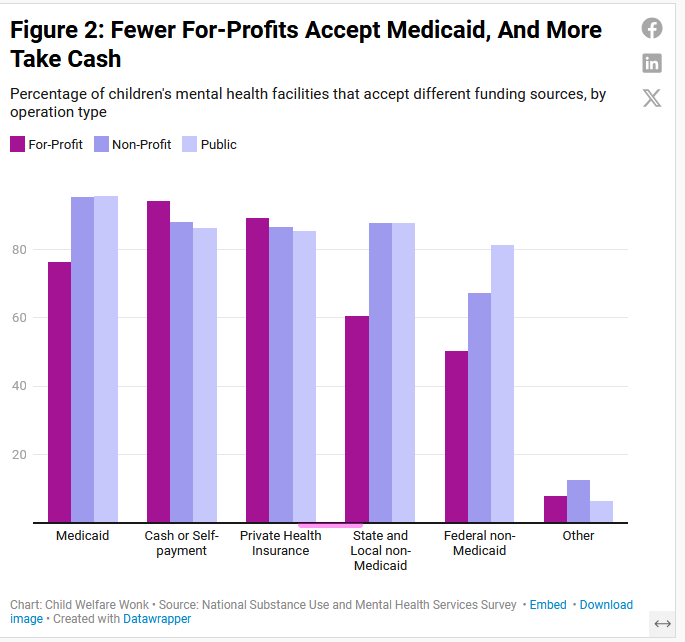
Fewer For-Profit Facilities Accept Medicaid, More Likely to Take Cash
The impact of ownership structure on access shows up most clearly in which payment sources facilities are willing to take.
Three quarters of for-profits accepted Medicaid in 2024, compared to 95 percent of non-profit and public facilities (Figure 2). That number actually went down from 2021, when 80 percent of for-profits accepted Medicaid.
Even fewer for-profits accepted other government sources - 60 percent accepting state and local funding, and half accepting federal sources.
Nearly 90 percent of non-profit and public facilities accepted state and local funding. Two-thirds of non-profits and around 80 percent of public facilities relied upon non-Medicaid federal dollars.
Cash pay is another story. Nearly 95 percent of for-profits accepted cash payments from patient families, compared to 88 of non-profits and 86 percent of public facilities.
Will the Growth in For-Profits and Shift Away from Public Funding Continue?
Medicaid remains the backbone of treatment for children and youth, but participation varies by facility type. Even small declines in acceptance among for-profit providers can narrow options for publicly insured families, particularly where capacity is already limited.
The financing structure of children’s mental health care is facing a turning point.
The growth in for-profits and their ability to choose which funding source to accept suggest that access could become more uneven over time—especially for families who rely on Medicaid and other public sources.
These trends are not distributed evenly across the country. States vary widely in the share of for-profit facilities, which could create regional exacerbations.
These findings don’t show a collapse in access—they signal early indicators of imbalance.
Tracking how financing patterns evolve will be critical to understanding where access is tightening, and what might stabilize it.
Methodological Details
This study used the National Substance Use and Mental Health Services Survey (N-SUMHSS), a comprehensive national source of data on substance use disorder and mental health treatment facilities’ geographic location, service provision, and operation characteristics. N-SUMHSS provides a unique source of information especially on privately operated facilities (86% of mental health treatment facilities are privately operated in 2024). To be eligible and included in the N-SUMHSS, mental health facilities must provide specialty MH treatment services. Solo or small practices not licensed or accredited as a mental health clinic or a mental health center are excluded from N-SUMHSS.
In our analysis, mental health treatment facilities who self-reported accepting client age groups of young children (0-5), children (6-12), or adolescents (13-17) are coded as child-serving mental health treatment facilities. Facilities reported various types of client payment, insurance, or funding accepted for mental health treatment services.
For easy and clearer demonstration, we combined non-Medicaid state level payment and funds, including state-financed health insurance plan other than Medicaid, state mental health agency (or equivalent) funds, state welfare or child and family services agency funds, state corrections or juvenile justice agency funds, state education agency funds, and other state government funds.
We then combined the state level and “county or local government funds” where 95% of facilities who accept county or local government funds also accept at least one state level non-Medicaid payment and funds. In addition, we combined “private or community foundation” funds and “other”, both of which account for lower than 7% of all child-serving facilities.
We exclude Medicare payment because children can only get Medicare if they are disabled under very specific circumstances. According to CMS enrollment numbers, in 2023 only 1,223 children were on Medicare.
Facilities self reported their ownership - whether they are operated by private for-profit organization, private non-profit organization. We coded the facility as publicly operated if they are operated by state government, local, county, or community government, tribal government, or federal government.
Statistical proportion tests are conducted. While not all results are statistically significant, all proportion differences highlighted in the report are statistically significant at 0.05 level.
There are several limitations of N-SUMHSS. First, it does not capture the monetary value of the payment, insurance, or funding from different sources, nor the compositions of all the income sources. It is a simple yes/no response on acceptance.
N-SUMHSS cannot drill down below the state level. Our data can’t tell us how providers are distributed within states, whether private facilities are more likely to be in areas with limited treatment options, and the breakdown between rural and urban areas.
The data can’t tell us about facility capacity. That’s key because the presence of a facility that accepts public funding doesn’t mean that the facility can accept new patients.
Or that the facility will prioritize kids whose treatment will be paid by public sources, who may have lower payment rates than other sources.
Other research can give us hints into what is likely going on within states. We expect rural areas to be most affected by capacity constraints. Research shows that rural counties have fewer mental health facilities; less than 30 percent of rural counties had at least 1 youth-serving mental health facilities between 2017 and 2019 (Graves, et al. 2020).
References
Graves, Janessa M., Demetrius A. Abshire, Jessica L. Mackelprang, Solmaz Amir, and Ashley Beck. 2020. “Association of rurality with availability of youth mental health facilities with suicide prevention services in the US.” JAMA Network Open 3(10): e2021471. doi:10.1001/jamanetworkopen.2020.21471.
Weil, A. R. (Ed.). (2025). Addressing the Child and Adolescent Mental Health Crisis. Aspen Health Strategy Group