

The IV-E Mirage: How Low Eligibility Rates Undermine Federal Match Rates for Foster Care Maintenance Payments
By Laura Radel, Child Welfare Wonk Senior Contributor

The IV-E Mirage: How Low Eligibility Rates Undermine Federal Match Rates for Foster Care Maintenance Payments
By Laura Radel, Child Welfare Wonk Senior Contributor
Title IV-E sets a federal match rate for foster care maintenance payments – determining how costs are split between the federal government and the state.
This match rate, known as the Federal Medical Assistance Percentage (FMAP), is designed to vary by state: the lower a state’s per capita income, the higher its FMAP.
But FMAP is only part of the equation.
The actual federal reimbursement a state receives also depends on how many children in foster care meet Title IV-E eligibility requirements.
This dynamic creates a disconnect between the match rate’s intent – to direct more help to poorer states – and its real-world impact, where effective match rates can be lowest in states with the highest FMAPs.
Match Rates in Theory
In the foster care program, maintenance payments – payments for the board and care of eligible children in foster care – are reimbursed at the Medicaid FMAP which varies by state.1
FMAP varies by state, with higher rates for states with lower per capita incomes, and rates vary from 50 percent to 83 percent.
Match Rates in Practice
States’ actual reimbursements depend on two important factors:
The state’s FMAP
The eligibility rate – the proportion of children in foster care who qualify under Title IV-E.
This is where theory diverges from practice. States with higher FMAPs often have lower eligibility rates, meaning they qualify for a high federal match.
But it’s functionally a mirage, because it applies to a much smaller share of their foster care population.
Nationally the Title IV-E eligibility rate in 2023 was 35.8 percent, down from 67 percent in 2000.
States’ individual eligibility rates range from less than 10 percent to nearly 100 percent.
Why Eligibility Rates Vary
While there are several Title IV-E eligibility requirements, two factors shape these differences among states’ eligibility rates.
The Lookback Provision
The first is the income limit established by the so-called lookback provision, which locks states into the income eligibility rules used by the state’s welfare program in 1996.
Many states with high FMAP rates had very low income and asset limits, and after 30 years without inflation adjustments those income limits today mean even very poor families are often excluded.
Ineligible Placement Settings
The second is how many otherwise eligible children in foster care live in ineligible placement settings – that is, settings that don’t qualify for maintenance payments – including children living in unlicensed relative foster homes or ineligible congregate care placements.2
Some of the states with low FMAPs rarely license relatives as foster parents, excluding many children in relative foster care from Title IV-E eligibility.
Nominal Versus Effective Match Rates
While FMAP reflects a state’s nominal match rate, what really matters for following the funding is the effective match rate:
FMAP × IV-E eligibility rate = effective match rate
For example, a state that receives 50 percent reimbursement for 40 percent of children in foster care effectively receives 20 percent reimbursement.
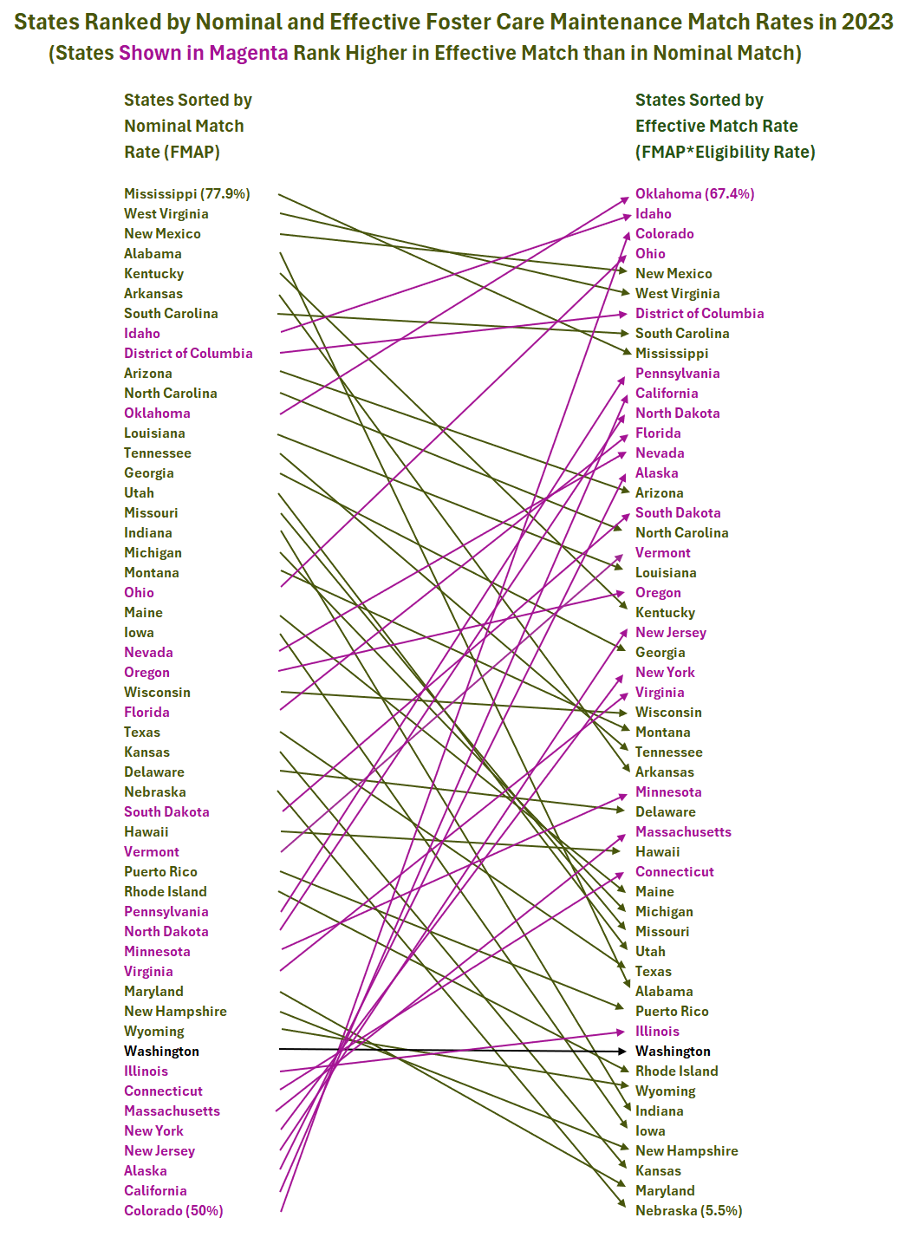
In 2023, the effective match rates varied from just 5.5 percent to 67.4 percent, depending on the state.
To illustrate:
Alabama and Kentucky had nearly identical 77 percent FMAPs.
But Kentucky’s eligibility rate led to an effective match rate of 22.4 percent, nearly 9 percentage points higher than Alabama’s (13.8 percent).
Pennsylvania, which had a much lower FMAP of 52 percent, had a higher IV-E eligibility rate, making its effective match (28.5 percent), about 6 percentage points higher than Kentucky’s, and nearly 15 percentage points higher than Alabama’s.
The figure below illustrates how states rank on both the nominal and effective match rates.
The map graphic shows how differences in nominal and effective match rates are distributed geographically.
Takeaways for Policymakers
This analysis reveals two key points.
The Federal Share is Much Smaller Than It Appears
Because only about a third of children in foster care nationally are Title IV-E eligible, the federal government pays a relatively small share of states’ overall costs for foster care maintenance payments.
In 34 states the effective match rate is less than 25 percent.
This is a core structural tension in child welfare financing; federal policy sets foundational rules while providing a minority share of financing.
Program Design Exacerbates States’ Uneven Footing
FMAP was designed to provide more support to states with fewer resources.
But eligibility restrictions — especially the outdated lookback rules — often mean those states receive less, not more.
Title IV-E eligibility rates are depressed by the lookback date, which, short of federal statutory change, states can do nothing to avoid.
Today the program’s income limits for a family of four range from just 14 percent of the federal poverty level to 89 percent, depending on the state’s 1996 welfare program rules.
In states that had the most restrictive rules, household incomes of less than $5,000 per year can render children ineligible for Title IV-E.
The Options States Have Under Current Policy
States can make choices that affect how many children are excluded from Title IV-E eligibility because of their placement settings.
Since the passage of the Family First Prevention Services Act (FFPSA), most states have decreased their use of congregate care and have licensed some existing settings as Qualified Residential Treatment Programs (QRTPs) to avoid loss of federal reimbursement.3
In addition, new regulations finalized in 2023 allow differential licensing standards for relative foster care placements and provide the opportunity for states to make more relative care Title IV-E eligible.
Key Takeaway
In policy debates, FMAP is often treated as a proxy for how much federal support a state receives. But focusing on FMAP alone misses a key part of the picture.
Eligibility rates are the real outcome to track, while FMAP serves as one input.
To understand federal foster care funding — and its shortcomings — we need to look at effective match rates (FMAP x Title IV-E eligibility rate), which reflect the actual share of costs reimbursed.
And those rates show that many states, particularly those meant to benefit most from FMAP, are getting far less than intended.

Laura Radel is a Child Welfare Wonk Senior Contributor.
Before retiring, she spent 35 years analyzing child welfare issues for the HHS Office of the Assistant Secretary for Planning and Evaluation (ASPE).