

Weekly Wonk: Family First, Light on Families
Digging the latest Family First data, plus deregulation comes to child care
From the Founder’s Desk
It’s no secret that child welfare financing is structurally stuck, with the federal share of investment fading and long prioritizing foster care over prevention.
The Family First Prevention Services Act embodies a clear ambition to address both of those factors, with a major expansion of open-ended funding to prevent foster care.
We now have five years of expenditure data from Family First. This week’s Deep Dive analyzes them, surfacing signals of bigger barriers to implementation than a time lag.
And for our premium members, we will have forthcoming complementary guidance on what you can actually do about these barriers in your work.
Our newsletter maps what matters in child and family policy, and our premium resources unpack what you can do about it.
Our latest premium brief from Sarah Catherine Williams is a great example, showing how leaders in our field can thoughtfully approach generative AI.
To go premium, individuals can sign up here, or get the team membership rate here.
Let’s get after it.
Weekly Wonk Deep Dive
Family First, Light on Families
Persistently high administrative claiming and low caseloads point to real rate limits in Family First.
By Zach Laris, MPH
The Family First Prevention Services Act emerged from an architectural ambition; reorienting federal child welfare financing toward prevention.
Eight years after enactment, the first five years of expenditure data are in.
Across that span, the program supported 53,055 cases and spent nearly 60 cents of every dollar on administration.
Family First faces an implementation lag like any major federal financing change.
Beneath the typical growing pains, though, are signals of a structural pattern that raise hard questions about how Family First’s policy design shapes what it can deliver.
FFPSA At A Glance
Federal child welfare financing was primarily built around foster care.
Title IV-E of the Social Security Act is the core open-ended federal child welfare funding stream.
Even today, thirty years into the structural tension of income eligibility limits that don’t adjust for inflation, foster care is over half of Title IV-E spending.
For decades, federal financing focused on foster care and permanency through adoption and guardianship assistance.
Preventing foster required cobbling together capped federal funds and state resources.
The prevention that Title IV-E could fund was constrained by cost-neutrality requirements in waivers, or complex administrative financing with low match rates.
Family First aimed to fundamentally change that.
Enacted in 2018, it opened up Title IV-E for evidence-based prevention services.
Open-ended federal financing could support families on the edge of foster care entry through home visiting, mental health, and substance use treatment services.
The key change relative to foster care was prevention would have no income limit.
That meant no structural cap on what states could eventually claim beyond their ability to put up matching funds.
The theory was that the money would not just fund prevention, but increasingly emphasize it structurally.
That’s what happened with adoption assistance after ending the federal income test.
Looking at the latest data for FY 2024, that is not yet happening for prevention.
Prevention services were two percent of the $9.6B in federal spending, and prevention spending actually decreased nearly eight percent.
A caveat on that decrease; these ACF expenditure data are “as reported”.
An early signal is usually the grant “awards” that show up in HHS’ Tracking Accountability in Government Grants System (TAGGS) data.
For FY 2020 through FY 2023, expenditure and TAGGS awards data are very close, but for FY 2024 the difference between the two is 5 percent of reported expenditures.
Since claims are adjustable for eight quarters, it’s possible FY 2024 may rise over time with retroactive claims to catch up from delays or administrative barriers.
Let’s Run the Numbers
Thirty-one states have claimed funds at some point. Thirty1 did so in FY 2024.
Over five years, Family First prevention spending totaled $858 million, including $462 million in federal resources.
Those dollars supported a documented caseload of just over 53,000 families across the five-year period.
For comparison, Title IV-E foster care served over 665,000 children over that time, and adoption assistance covered over 2.7 million.
In FY 2024, 87 percent of Title IV-E services spending flowed to the highest evidence tier of “well-supported” interventions.
This reflects service array decisions that are rational for each individual decision maker, yet can become inefficient in aggregate.
The law requires half of spending to be on that top category, which serves as a real rate limit on what states can deploy.
Average per-caseload prevention spending was just over $10,000, though that figure masks enormous variability across states.
Sometimes financing changes grow logarithmically; initially slow, eventually exponential. That’s not what the pattern so far points to.
These data signal real structural tensions in the law, and suggest that what gains we see may reflect progression despite those limits, rather than compounding growth.
Why Administrative Claiming Drives Family First
Across five years, nearly 60 percent of Family First spending has gone to administrative claiming.
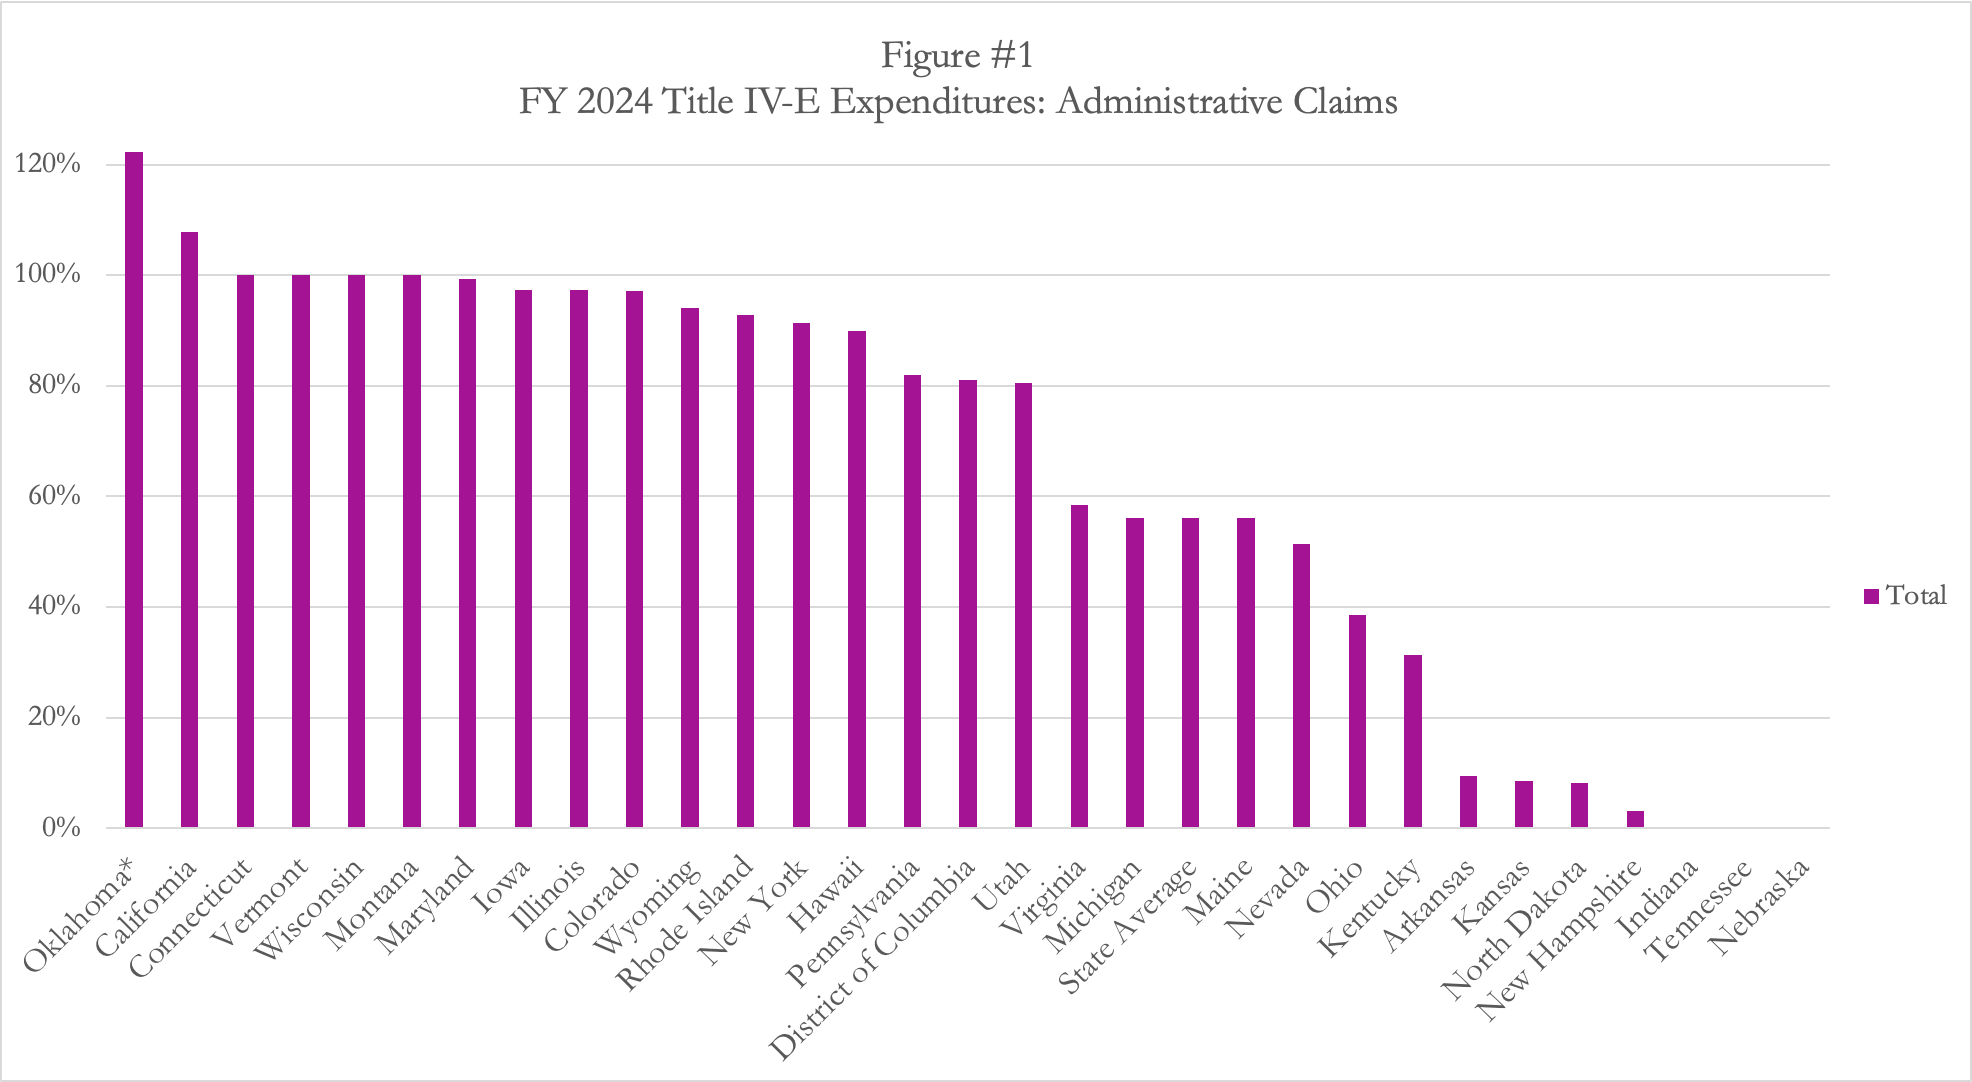
In FY 2024, the figure was 56 percent nationally, but that number is artificially low for two reasons.
First, Indiana, Nebraska, and Tennessee reported claiming services funding under Family First without claiming administrative funds.
Remove them, and the national average jumps to 68 percent.
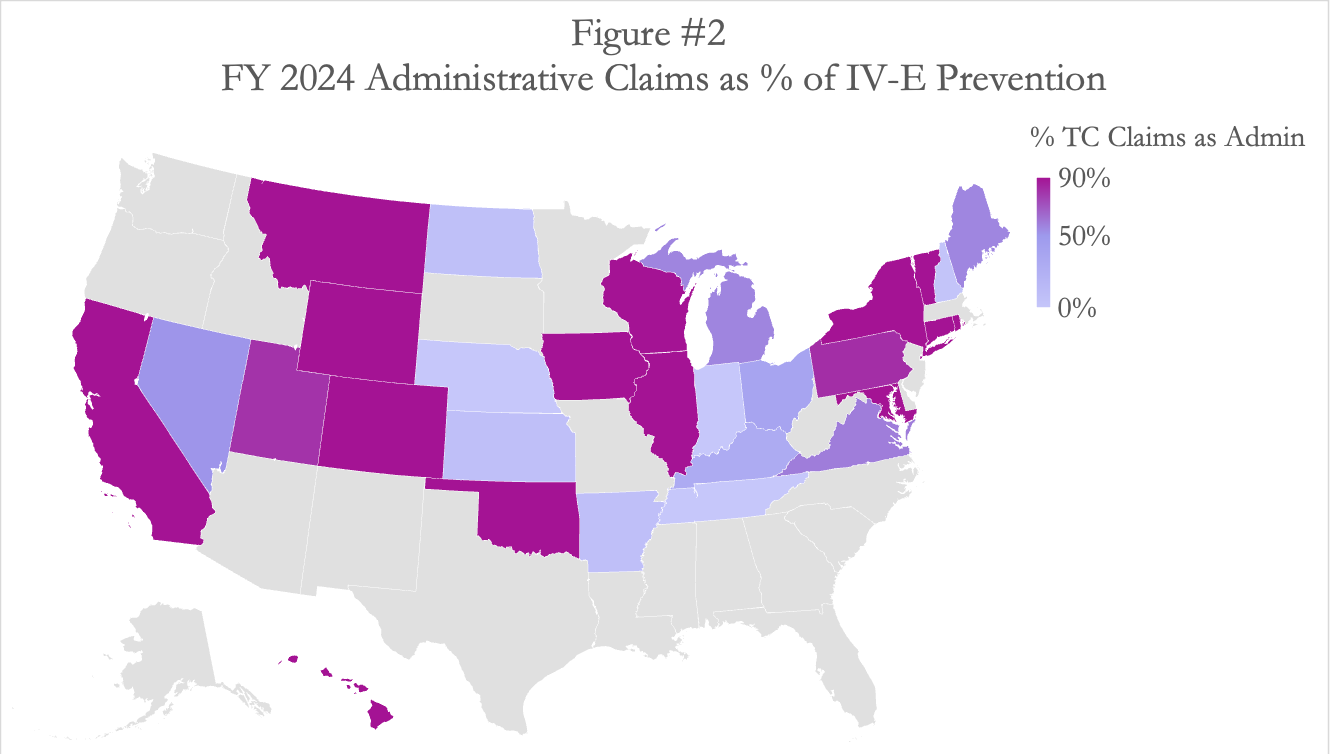
Administrative claiming represents more than 90 percent of total computable claims for just under half of all claiming states. Five states claim only administration.
None of this is suggestive of something inappropriate.
Administrative claiming doesn’t mean waste or overhead. It’s federal investment in state capacity, staffing, and infrastructure, which are key for last-mile policy delivery.
And there are real barriers to services claiming that explain some of what’s happening here, which state leaders can easily identify.
But if implementation were progressing, we’d expect the services share to be growing.
Instead, other than early swings, the administrative share has been essentially flat since the program launched.
Caseload Variability Complicates Interpretation
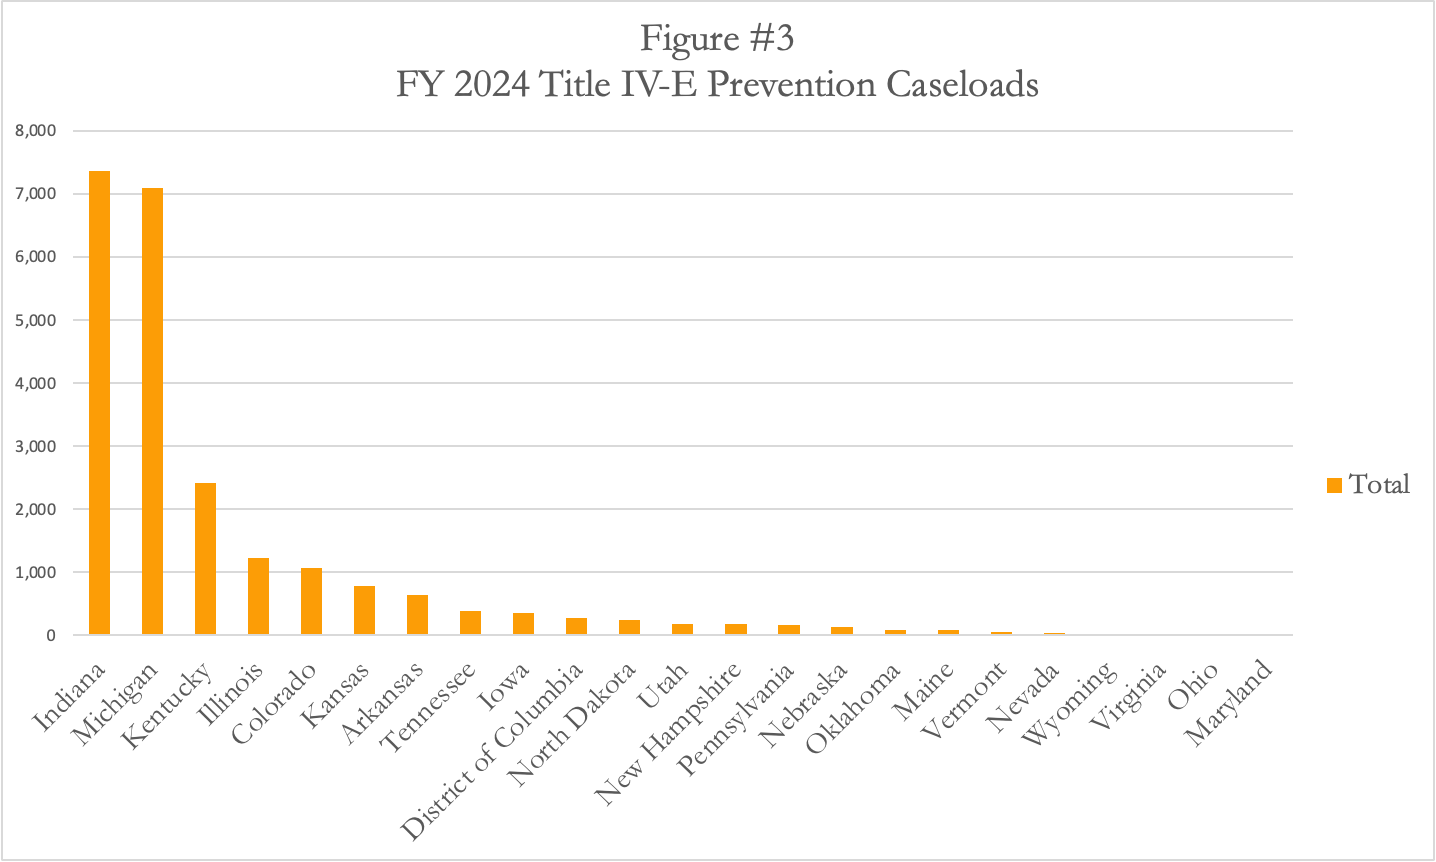
Family First’s five-year caseload totals just over 53,000 families, with 22,809 of them in FY 2024.
That caseload is unevenly distributed, with just two states, Indiana and Michigan, providing half of it. Figure 3 displays states reporting a caseload greater than zero.
The per-caseload figure is where things get stranger.
Average Title IV-E prevention spending per caseload in FY 2024 was $13,951.
That average covers significant variation, including three states with per-caseload spending over $1 million.
Roughly five percent of all Title IV-E prevention spending in FY 2024 was the $17 million that went to seven states with a caseload of zero: CA, CT, HI, MT, NY, RI, and WI.
These are all states that recently began implementation, which means they may be leveraging administrative claiming to prepare for implementation.
These limits also may point not to a lack of serving families, but to structural limits within the law.
Key Structural Tensions
The surface story is a slow-scaling program. These expenditure data signal three distinct structural tensions within Family First beneath that surface story.
The “Prove-It” Problem: Evidence Tiers as Bottleneck
The law requires half of prevention services spending to meet the “well-supported” standard.
States are hitting 87 percent. That rigor is also a rate limit.
Only a handful of all the programs that meet any of the evidence tiers fit in that top category. Heavy concentration there narrows what states can actually deploy.
This also means it may make more sense for leaders to leverage administrative claiming, which doesn’t count toward that spending limit and risk an overage.
If You Can CAP it, You Can Claim it: Administrative Claiming
High admin rates could reflect several things at once.
To start, Title IV-E typically matches administrative claims at a rate of 50 percent and services at a state’s Federal Medical Assistance Percentage (FMAP) rate.
For Family First, though, services are 50 percent match until rising to FMAP on October 1, 2026.
The rules for Title IV-E administrative claiming provide for a wide range of allowable activities, including case management, case planning, child care, transportation, peer navigation, and more.
The biggest limit to leveraging those is a sufficiently broad Cost Allocation Plan to parcel out expenses across federal financing streams.
It’s also possible that agencies may be delivering broadly-used interventions like motivational interviewing through in-house staff.
Given the equivalent match rate, there wouldn’t be a huge incentive to break it out.
We may also be seeing the use of community eligibility pathways, which leverage Title IV-E prevention financing without bringing families “into” the child welfare system.
What makes that hard to say with certainty is that it doesn’t map neatly to the data.
For example, Connecticut and Indiana are both using that community eligibility approach, but have admin claiming rates of 100% and 0%, respectively.
One possibility for states that have services claims that are relatively higher than administrative claims is the use of contracted service providers.
An added limitation here is that these expenditure data don’t differentiate child-specific and non-child-specific administrative claims.
That matters because a trend in early states has been claiming non-child-specific administrative funds first, then expanding to child-specific ones.
Early in implementation, it may also still be difficult to separate foster care and prevention services administrative claims, which could impact reported trends.
Who’s On First? The Medicaid Overlap and Payor of Last Resort
Family First is also the payor of last resort. That means that when Medicaid could cover something, it has to fully cover what it would first, before Family First kicks in.
That’s atypical; Medicaid is usually the payor of last resort for other programs.
This creates complications, because where Family First could pay for an intervention, it may not be able to. That’s where administrative funds come in again.
Family First administrative funds can pay for the wraparound supports that make an intervention possible, even when Medicaid is paying for the actual service.
Those prevention administration dollars can then cover what Medicaid doesn’t, with things like case management, childcare, peer support, and transportation.
States navigating that boundary carefully may have systematically high admin rates not as a workaround but as a structural consequence of coordination.
That can be pointing at both a bottleneck and an opportunity:
Bottleneck: Ambiguity and perceived barriers could lead to under-claiming; and
Opportunity: Since Title IV-E prevention administrative funds can pay for complementary services, there’s a major opportunity to leverage them together.
We have more in the works here for current/prospective premium members
Each explanation is plausible. Some are probably operating simultaneously.
Looking Ahead
Near-term, this all points to a practical problem for states: maximizing drawdown and use of available resources within the program’s existing constraints.
We’ll have upcoming analyses for premium members that examine exactly that.
Longer-term, there are harder questions that go beyond implementation mechanics and into policy design.
Evidentiary standards, payor of last resort requirements, and differential friction between administrative and services claiming are questions for those making, shaping, and influencing policy.
Grappling with those serious questions offers the opportunity to find plausible pathways to match the law’s scale trajectory to its original ambitions.
Wonkatizer
Fostering the Future Executive Order at 180 Days
What Happened
The White House Executive Order on Fostering the Future for American Children and Families hit a key milestone of 180 days since its signing, with key deadlines for action.
ACF released a comprehensive 180-day update and announced a new Home for Every Child competitive challenge with $7M in incentives for the top states.
Why it Matters
ACF is marking the Executive Order as both an organizing frame and show of accountability to a priority issue area for First Lady Melania Trump.
What to Watch
How durable these shifts proves to be, since they embody a big bet on policy durability as a function of buy-in.
Deregulation Comes to Child Care
What Happened
On May 11, ACF issued a package of policy changes that together represent a significant de-regulatory shift in federal child care financing and oversight.
Why it Matters
Elliot Haspel has covered multiple connections of child care and child welfare for us.
ACF has already made significant de-regulatory moves impacting child welfare.
Changes to ACF’s child care regulations have a higher likelihood of facing friction, as they cover topics familiar to all parents like health, safety, and staff-to-child ratios.
What to Watch
The package includes both final rules on child care and proposed ones for comment, like Head Start.
Wonks will be watching whether the child care rules face any opposition or legal challenges, and weighing in on Head Start rules until June 11.
That’s it for this week.
Stay sharp, Wonks.
Z
Partners Making Your Weekly Wonk Possible


West Virginia has $0 in reported claims for FY 2024.