

Child Welfare Wonk's Funding Uncertainty Vulnerability Index
Which state child welfare agencies disproportionately rely on key federal programs?

CWW Analysis: Funding Uncertainty
Assessing State Vulnerability to Federal Funding Fluctuations
2025 brings a nonzero chance of significant changes to and reductions in funding for key federal child welfare programs, including:
Title IV-E of the Social Security Act (57% of federal child welfare funds)
TANF (19% of federal child welfare funds)
Social Services Block Grant (SSBG) (10% of federal child welfare funds)
Medicaid (7% of federal child welfare funds, not including its coverage)
Over half of child welfare funding comes from state and local sources, but that’s a national level average that masks significant variability.
The key to understanding states’ relative risk from federal funding uncertainty requires understanding both what they receive and what they invest.
Introducing the Child Welfare Wonk Federal Uncertainty Vulnerability Index
Nothing cuts through the fog of confusion and overwhelming data like a good chart. So Child Welfare Wonk is here to offer you the Federal Uncertainty Vulnerability Index.
To assess which states face the greatest risks to their total child welfare funding, this analysis looks at the most recent ChildTrends Child Welfare Financing Survey.
This data set is unique in offering us details on child welfare agencies’ total spending, broken out by state/local and federal funding.
By crunching the available data,1 we can see which states report disproportionately relying upon these federal programs for their child welfare funding.
This inaugural Federal Uncertainty Vulnerability Index finds 17 states that report over half of their total child welfare spending from IV-E, Medicaid, SSBG, and TANF.2
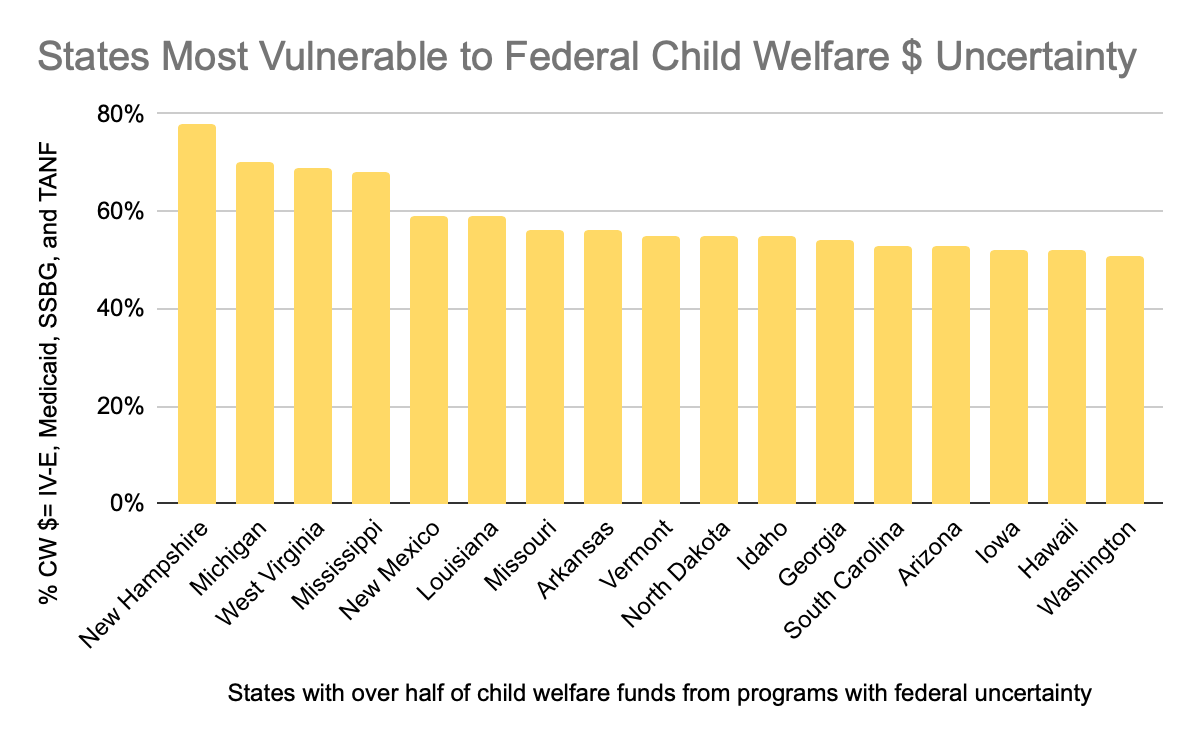
Whenever a new edition of the ChildTrends Financing Survey comes out, we will run this analysis again.
Standard caveats apply; every data set has strengths, weaknesses, and limitations. This one has to exclude CA and WY since they did not report state/local spending. And some states did not report for all analyzed federal programs, and so may have greater federal uncertainty vulnerability risk than we can see.
Analysis excludes CA and WY, which did not report state/local spending data.