

Mapping A Home for Every Child: Where Do States Stand?
How many homes does each state have for every child in foster care?
Mapping A Home for Every Child: Where Do States Stand?
How many homes does each state have for every child in foster care?1
By Laura Radel, Senior Contributor
Editor’s note: This is the first in a three-part series examining where states stand on ACF’s Home for Every Child ratio goal.
Parts two and three will be available exclusively to Wonk Briefing Room members.
We’ve been examining the constraints facing the Administration for Children and Families’ (ACF) A Home for Every Child initiative.
That includes the limits of the 1:1 ratio as a metric to the behavioral health ceiling that shapes what foster homes can actually sustain.
This piece adds a foundational piece to that picture: a state-by-state benchmark of where things actually stand today, and from which all states will start
ACF’s A Home for Every Child initiative sets the goal that states have at least as many foster homes as there are children in foster care – a 1:1 ratio.
As we’ve previously described, that’s about double the current ratio of homes to children nationally.
But we know national averages often mask significant state variability.
So, where does each state stand on this goal today?
There is no authoritative federal data on states’ stock of licensed foster homes.
The best data on the topic has been collected by The Imprint’s Who Cares: A National Count of Foster Homes and Families, which has tracked foster homes counts from states since 2019.
This analysis is based on the Who Cares counts of foster homes, and on federal AFCARS counts of children in foster care.
For each year we calculate the ratio of foster homes available on March 31 of a given year in the Who Cares data to the AFCARS count of children in care the previous September 30.
These September AFCARS figures offer a representative and official indicator from which to benchmark.
The National Picture
First, let’s start with the national picture.
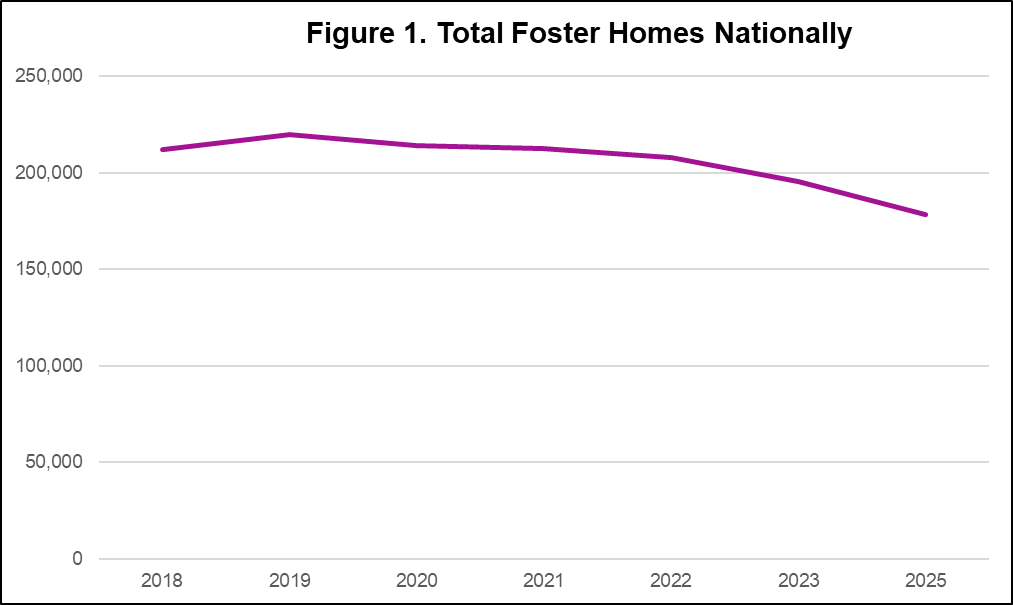
Nationally, the number of foster homes declined from about 212,000 in 2018 to 178,000 in 2025 – a loss of 36,000 homes or 17 percent.
Most of that decline has occurred since 2022.
There were 0.53 foster homes in 2025 for every child who was in foster care on September 30, 2024.
The ratio has been increasing incrementally in recent years, from 0.51 in 2019 to 0.53 in 2025.
That national figure masks enormous variation across states.
Where Every State Stands
No state currently achieves the 1:1 ratio goal.
However, six states come close:
California
Idaho
Pennsylvania
Vermont
Virginia
Wyoming
Each has ratios of 0.8 or higher
States range from a low of 0.21 in Arizona to 0.93 in Idaho.
There are 26 states with ratios greater than 0.5, which means they currently reach at least half of ACF’s goal.
There are 12 with ratios greater than 0.66, or about two-thirds of the way to the goal.
Always Be Closing: Why the Gap Persists
Most states have a long way to go to meet ACF’s challenge of achieving a 1:1 ratio of foster homes to children who need care.
Gains needed in most states far outstrip any changes in either the supply of foster homes or the decline in children in care in recent years.
In the states with ratios below 0.5, meeting the goal of a 1:1 ratio would require doubling or more the number of licensed foster homes, halving the number of children in foster care, or some combination in between.
We’ll explore this dynamic in greater depth in a forthcoming piece.
In addition, high turnover among foster parents means many more new foster parents would be needed than are apparent from calculations like those presented here.
That’s because recruitment would need to account for turnover.
There’s also a supply-side risk worth watching.
If states add hundreds or thousands of new foster homes to their supply while further decreasing the number of children in foster care, and continuing to follow best practice of placing siblings together whenever possible, many of those new homes will never see a child placed in them.
That could manifest as mirage; as we’ve examined, raw home counts don’t measure how well matched a home is to the unique needs of:
Sibling groups;
Older youth; and
Children with complex behavioral health needs.
A ratio alone won’t tell us if the supply is matched to the population’s needs.
The Road to 1:1
A Home for Every Child is now the organizing principle behind all major ACF child welfare policy initiatives.
Seeing it clearly, state by state, is essential for looking at what’s possible and what’s next.
The next two pieces in this series will go deeper on both the trajectory and the math.
The second will examine how the ratio has changed over time in each state: which states are gaining ground, which are losing it, and how fast.
The third will model what it would actually take to reach 1:1 under different strategies.
Several states have announced their participation in ACF Assistant Secretary Adams’ challenge to strive toward a 1:1 ratio with more likely to follow.
For most, the starting line is farther back than the goal may suggest.
Since publication of part 1 in this series, further analysis revealed both an error in my initial calculation of the ratio change for one state (Washington) and that the substitute data used for both Washington and Wyoming (which did not submit AFCARS data for 2024) had produced results that suggested potential data comparability issues.
Therefore, we’ve updated the map for this piece to drop WA and WY from the analysis, and will be leaving them out for subsequent analyses of this data set.